

Balancing short-term results with long-term growth is an ever-present challenge for company leaders. For decades, traditional economic profit metrics—most notably Economic Value Added (EVA)—have been proposed to manage this trade-off. While EVA has demonstrated certain strengths, it has also faced criticism for its complexity and its potential to discourage investment.
But developments in economic profit measurement have led to approaches now favored by institutional investors and proxy advisory firms such as ISS. One such measure, Residual Cash Earnings (RCE), initially introduced in the Journal of Applied Corporate Finance, draws on over 25 years of research and aims to address EVA’s weaknesses while preserving its core strengths.
Revisiting EVA
EVA measures profit beyond the return investors could earn elsewhere, incorporating growth, margins and capital productivity. Research has shown that companies adopting EVA-like metrics often outperform peers in total shareholder returns (TSR).
However, two recurring challenges have emerged in practice:
- Complexity. EVA involves numerous accounting adjustments, which can make it difficult for managers—particularly outside the finance function—to interpret and apply effectively.
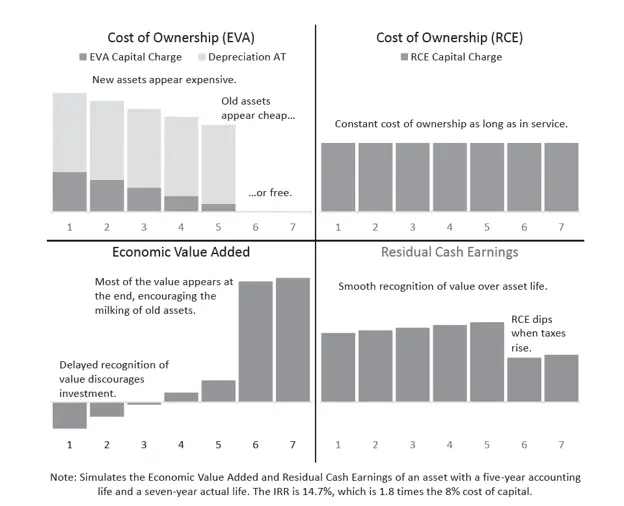
- Investment Disincentives. The treatment of depreciation and capital charges can create a bias against new investment, as older assets appear “free” while new ones seem costly in their early years. This dynamic can delay or reduce investment in growth, R&D or asset renewal.
The RCE Alternative
RCE was developed to maintain the conceptual rigor of EVA while simplifying its application and removing biases against new investment. The method involves only a small number of adjustments, primarily:
- Handling depreciation consistently
- Capitalizing R&D, similar intangibles and other “P&L” investments like operating leases
The calculation starts with gross cash earnings (EBITDA plus R&D and rent, minus taxes) and subtracts a capital charge on gross assets—restoring accumulated depreciation and capitalized intangibles to the asset base. This approach applies a consistent capital charge over time, avoiding EVA’s tendency to reduce charges on aging assets.
The result is a measure that can indicate positive value creation earlier in the life of an investment, potentially encouraging timely strategic action. We depict the differences in cost of ownership for RCE and EVA in Figure 1 below.
Figure 1 – RCE vs EVA Cost of Ownership and Behavioral Impact
Illustrative Example
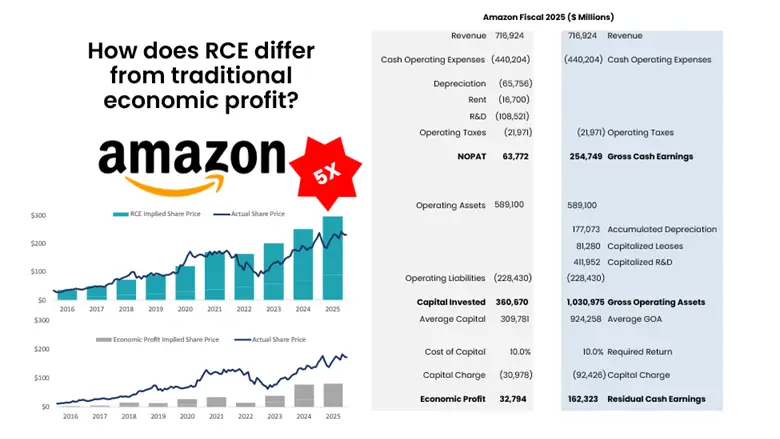
We’ve covered the technical side, but let’s show how RCE works in practice. In Amazon’s 2025 results, EVA calculated just $33 billion in economic profit on $361 billion in average capital. On a gross asset base of just over $1 trillion, RCE was $162 billion, fully capturing the value of ongoing investment, as shown in Figure 2. Back-testing suggests that RCE valuations have more closely tracked Amazon’s share price over time compared to EVA.
These results are not limited to Amazon. Our research published in Beyond EVA indicates that, across industries, RCE correlates more strongly with TSR than EVA, suggesting it’s a more reliable indicator of long-term performance.
Figure 2 – Valuing Amazon with RCE
Strategic and Behavioral Implications
Because RCE is expressed in absolute monetary terms (i.e. dollars), it effectively dollarizes returns to capture both quality and scale in decision-making. This helps avoid the distortions that can occur when relying solely on percentage-based measures like ROIC or margin. After all, dollars pay rent and bonuses, not percentages.
For example, in acquisition analyses, EVA and ROIC may show negative results for several years due to high initial capital charges, even when net present value is positive. RCE’s constant capital charge can reveal value creation from the outset, aligning more closely with shareholder interests.
Because of this ability to align shareholders and managements’ interests, RCE is often used in executive compensation systems to link pay to value creation. By focusing on RCE improvements, organizations can align incentives across roles and functions on a shared goal of real value creation.
Broader Outcomes
Although most applications of RCE focus on shareholder value, research indicates that companies that deliver high RCE also tend to perform well in other areas, including employee engagement, customer satisfaction and community impact. This may reflect the broader discipline and resource allocation efficiency that RCE encourages.
However, these broader outcomes are only realized through a deliberate change management process that typically involves a combination of training, integration into budgeting and planning, and formation of cross-functional teams to identify value-enhancing initiatives. Adoption is often welcomed by investors and governance bodies, as RCE supports transparency and long-term alignment.
Given RCE’s strong relationship with total shareholder returns, investors and board members can be confident that the strategic allocation of resources that are guided by this measure will create long-term value. Because of its holistic (quality and quantity) nature, it’s ideal for comparing disparate uses of capital across the portfolio. Whether this means drilling deep into segment, product, regional or SKU performance—or weighing buybacks versus organic reinvestment versus that strategic acquisition on your docket—RCE provides a clear-cut answer on your best use of physical, financial and human capital.
Being able to rely on this one metric for decision-making provides the added advantage of a common language across different functions, allowing for more disciplined and paced decisions. As the former CFO of Ball Corporation, Scott Morrison, likes to say, “It makes meetings shorter.”
Conclusion
Residual Cash Earnings represents an evolution in economic profit measurement. By simplifying calculations, removing investment disincentives and aligning more closely with shareholder outcomes, it offers an alternative to EVA that may better support both strategic decision-making and organizational alignment.