
Editor’s note: CFO Leadership is hosting a webinar, “Stop Accepting Double-Digit Health Plan Increases,” August 5 on how to interpret what is driving your renewal, what data to request and when, and how to assess whether your current plan remains competitive. Register here.
Healthcare costs have become one of the most reliable line items on the American CFO’s budget—reliably rising, reliably outpacing revenue and, for most finance leaders, reliably outside their control.
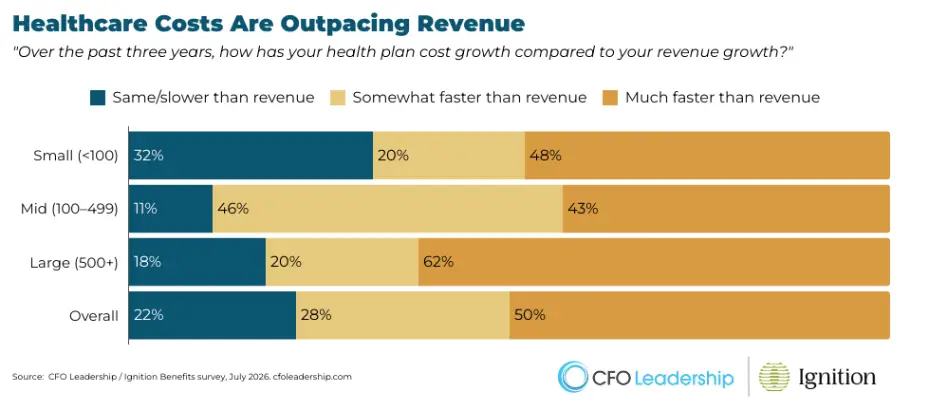
A new survey of nearly 150 U.S. CFOs conducted by CFO Leadership in partnership with Ignition Benefits finds more than three-quarters—78 percent—say their healthcare costs have grown faster than revenue over the past three years, with half describing that growth as “much faster.”
Yet despite the pressure and the fact that three-quarters say they are not satisfied with their current approach to managing healthcare costs, most are sitting still. Only about a third are actively pursuing options to change it.
For many CFOs, the biggest barrier to change isn’t contract lock-in, HR resistance or lack of time. When asked what limits their organization’s ability to meaningfully reduce healthcare costs, the top answer was uncertainty about whether anything different would actually lead to savings.
CFOs painted an overarching picture of deep frustration with the U.S. healthcare system. “Fundamentally broken,” “not sustainable” and “no recourse” were recurring phrases among survey respondents. Several called explicitly for systemic change, from single-payer models to eliminating the employer-based insurance structure entirely. “Get rid of Obamacare and return to a more fee for service competitive environment,” said Michael Concessi, CFO at Montpelier Roxbury Public Schools in Vermont.
For Mark Potensky, president-owner at Component Concepts, lack of regulation is also driving up what he calls his biggest expense. “WA State is out of control when it comes to health costs. Insurance companies can write their own ticket!”
Lack of transparency was another recurring theme. CFOs described being unable to see what carriers are actually paying, why renewal rates increase even after favorable claims years or what is specifically driving cost growth. Pharmacy costs, particularly GLP-1 drugs, came up repeatedly as a specific and growing opacity problem.
“We often see significant premium increases despite having a favorable claims year,” said Jeremiah Swett, CFO at Florida-based boat dealership Black Label Marine Group. “It feels like we’re forced to change carriers just to keep costs under control rather than being rewarded for managing claims effectively. More transparent pricing and renewal practices would go a long way toward helping employers make long-term healthcare decisions.”
The squeeze is sharpest in the middle. Among companies with 100 to 199 employees, 92 percent of CFOs report healthcare costs outpacing revenue, the highest of any size band. Even broadening the group to include those companies with 100 to 499 employees, 89 percent report costs outpacing revenue—well ahead of any other peer group.
The Blind Spot
Adding to the challenge is that many CFOs are flying blind, making decisions without a clear picture of where they stand.
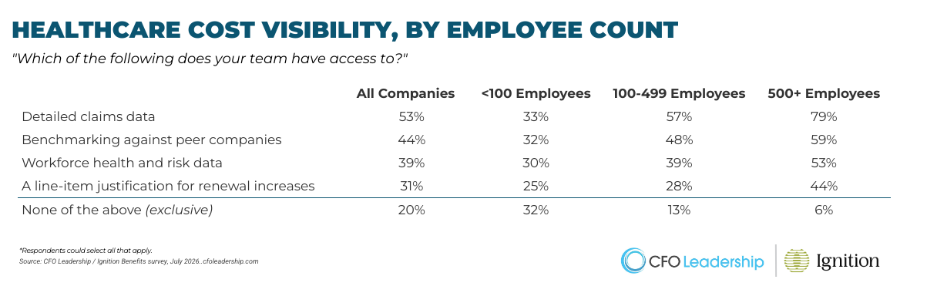
Only 39 percent of those polled say they benchmark their healthcare costs regularly and have a clear view of how they compare to peers. One in five report having no access to any of the data types that would help them understand what’s driving their costs—no detailed claims data, no workforce health and risk data, no peer benchmarks, no line-item justification for renewal increases.
That number rises sharply among smaller organizations. Among companies with fewer than 100 employees, 32 percent have no data access at all. In contrast, among the largest organizations (500+ employees), that number drops to 6 percent. In other words, small organizations are five times as likely as large ones to have no data access.
“The information asymmetry is the whole game,” says Nick Taranto, CEO and co-founder of Ignition Benefits, an independent employee benefits firm. “Carriers and brokers sit on the claims data, the risk data, the benchmarks, and the employer gets a renewal letter with a number on it. You can’t manage what you’re not allowed to see. The system is built that way on purpose.”
Amy Alost, CFO at Provident Specialty Group, a national construction and real estate development services company with fewer than 100 employees, said the market needs to be fixed: “The CFOs’ voice is muted due to the third-party broker in the middle. There is zero control, zero accountability, for these 8-38 percent YoY increases. This is NOT sustainable.”
At small organizations, a single high-cost employee can change everything, and options that exist in theory aren’t available in practice. “We only have 23 employees so it’s difficult to find affordable group health coverage,” said one CFO, explaining a common issue for this group.
Some CFOs point to flaws in the market. Dabney Wellford, CFO at Jefferson Area Board for Aging, said there is a “lack of a willingness for insurance companies to address the under 100 market.” The Virginia nonprofit is fully insured and experiencing costs rising at a much faster pace than revenue, something Wellford says they are actively pursuing options to change.
For Peter Kellogg, CFO at PMP Corporation, a Connecticut-based manufacturing firm, small businesses should not be responsible for providing health insurance to their employees. “We cannot compete on price with large corporations and do not have the bandwidth to manage the complexity of the health insurance system,” he said. “The entire health insurance model is based upon building complexity into the system so that all of the operatives within the system can create pricing power. It is an absolute travesty that we as a nation have allowed this system to continue and the number one thing that would help our organization and revitalize business formation in the U.S. is getting rid of this ridiculous employer-based model.”
But small organizations aren’t the only ones facing challenges in this area. Mid-sized organizations have meaningfully better access than small companies, but they, too, lag large ones across every data type—particularly detailed claims data, where the gap between mid (57 percent) and large (79 percent) is nearly as wide as the gap between small and mid.
Knowing Where You Stand
The correlation between visibility and a sense of agency is striking. CFOs who benchmark regularly are nearly twice as likely to say they are managing costs effectively as those with limited visibility. Not one of the respondents who said they benchmark regularly against peer data reported feeling “stuck” in this challenge.
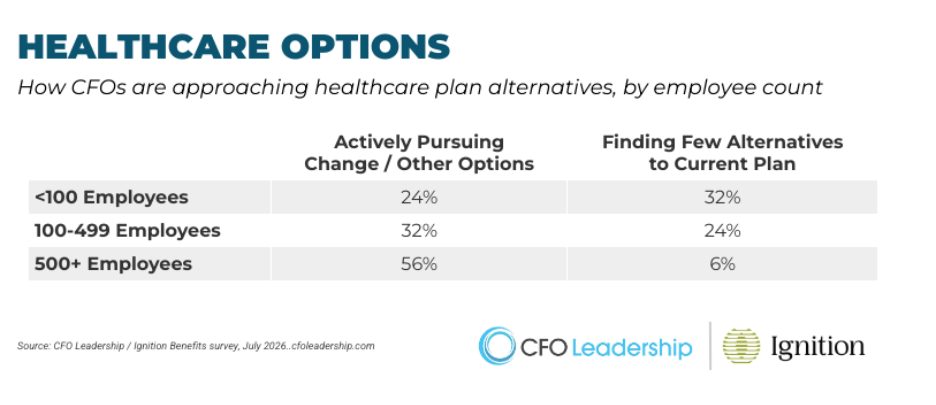
The gap between large and small organizations on this issue is also one of the widest. Among companies with 500 or more employees, 56 percent say they are actively pursuing options to reduce costs—and only 6 percent feel they have few real alternatives. Among companies with fewer than 100 employees, those numbers essentially flip: 32 percent say they have few real alternatives, and only 24 percent are actively pursuing change.
Mid-sized companies (100–499 employees) sit squarely in between: 32 percent are actively pursuing change, and 24 percent feel they have few real alternatives. This group faces a distinct challenge: They are large enough to know what alternatives exist, yet often lack the scale to access them on competitive terms.
“We feel we have few real alternatives,” said Steve Dorfman, CFO at Cellusuede Products, an employee-owned industrial manufacturer with fewer than 100 employees. “The market largely dictates what we pay.”
The reasons aren’t hard to understand. Smaller employers have less purchasing power, fewer realistic options for alternative funding arrangements, and less internal bandwidth to evaluate what’s available. One or two high-cost claimants can reset an entire year’s rate. And at the smallest end of the market, carrier competition is limited enough that shopping around often yields no better answer.
Funding Arrangements
Among the roughly one quarter of respondents who say they are managing costs effectively and are satisfied, nearly half—49 percent—are self-funded or in a captive arrangement. That’s nearly double their share of the overall sample.
Among all self-funded and captive respondents, 46 percent report satisfaction with their current approach, compared to 20 percent of fully insured respondents and just 5 percent of those in level-funded plans.
Level-funded and PEO respondents are the most resigned. Forty-five percent of level-funded CFOs and 50 percent of those in PEO arrangements say the market largely dictates what they pay and they have few real alternatives—the highest rates of any funding type in the survey.
For some CFOs, the problem with traditional plans is transparency. “It’s visibility into spend,” said one CFO at a Michigan-based wholesaler with 100-199 employees. “Now that we are self-funded through a captive, we have access to detailed data. Proactive management of pharmacy spend through a pharmacy benefit manager is extremely important.”
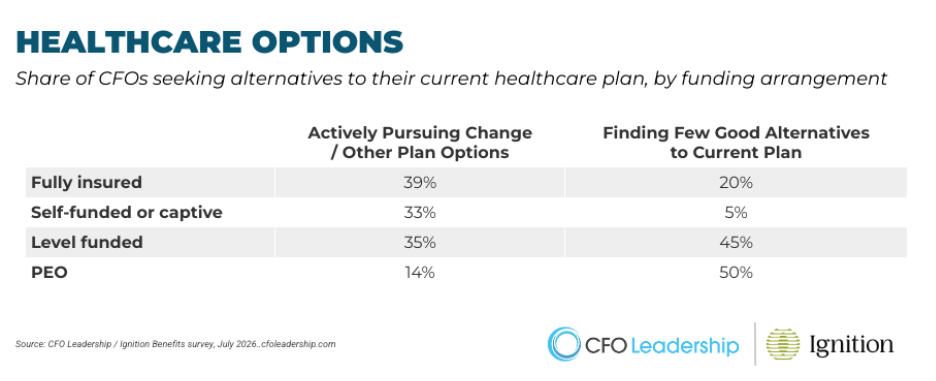
Still, no funding model eliminates cost pressure entirely. Costs are outpacing revenue at roughly 80 percent of organizations across all funding types—and even among satisfied CFOs, 57 percent say costs are growing faster than revenue. The difference is in the degree of control, not the direction of the trend.
Michael Fagan, CFO at Mental Health Association of Nassau County, a not-for-profit organization based in Hempstead, New York, agreed: “Market increases of 10 percent every year. Market is out of control with no support from federal government to help manage the market.”
“Cost increases no matter how you perform on the plan,” added another CFO, highlighting a common complaint among respondents. “No explanations provided for rate increases.”
“Switching funding models doesn’t make the cost pressure disappear,” says Taranto. “What changes is whether you can see what’s driving it. The self-funded and captive CFOs aren’t paying less by magic; they have the data to act before the renewal shows up.”